
Local SEO and Google Analytics
 Whether you pay for search engine optimization (SEO) or do it on your own, it’s important to know how it’s paying off for your local company or brand. Of course, this is easier said than done as it’s nearly impossible to determine whether you are top-ranked on search engines.
What you can determine is how many people are coming to your site and what leads to conversion and money in your hand. There are a number of ways to check return on investment (ROI) on SEO for your brand. We’ll go over a few of them below, specifically those related to Google Analytics, which makes checking on stats extremely easy.
Determine Need for Mobile Site
You can check under your Visitors menu to see whether a mobile version of your site would be beneficial. There is a Mobile option on the page where you can see what devices are used on your site and the percentage of people browsing from mobile.
Be sure to check out your bounce rate and average time on site here as it shows how long people stay on the site. If you find the mobile users spend less time on the site, you can determine that you are losing traffic and potential sales by not having a mobile site option.
Understand Shopping Cart Abandonment
For those with an online shopping cart and multiple step checkout, you can set up a Goal Funnel to understand what is causing people to leave. You just click on Goals and then create a new goal based on URL Destination. Toward the end of the goal you will include the last URL of checkout, which may be a thank you page. Click on Use Funnel to enter all the other URLs that correspond to making a purchase.
This lets you view reports that show when people leave the site while in the middle of purchasing. If a ton of people leave on the shipping page or payment page, that page needs work to make it friendlier to shoppers. Find out what is causing the issue and then fix it to bump up the number of sales you get.
Badly Performing Pages
On the content menu, you’ll see your top pages with your top exit pages below that. This shows you where people are coming into your site and where they are choosing to exit. If there are specific pages where people leave on a regular basis and that seem confusing, there may be a problem that is leading them to do so. It’s a good idea to evaluate these pages and content to see whether people are getting what they want. You could also post a call to action like purchasing a product or joining a mailing list.
Top Performing Pages
So, now that the badly performing pages are out of the way, let’s check out the best performing ones. Click on the Content Menu and click on Pages under Site Content. This lets you see information about pages that keep visitors for a long period of time or that lead them to visit more pages on your website. These are pages that are doing well and analyzing them can lead to making improvements elsewhere.
Visualize Clicks
If you want to know what people are clicking on more than average, go to In-Page Analytics under Content. Here you can see the percentage of clicks on each link your site has. You can hover over and click on these links to find out more information which may help to understand what people are clicking on and why. If you have something you want people to visit, try placing it somewhere that gets more clicks than other pages.
Search Results
Of course, keywords bring visitors to your site from places like Google and Bing. But it can be interesting to see what visitors are searching for on your actual site, too. If your site has a search box, head to Analytics and Profile Settings. Select the option to track site searches. Fill that in appropriately so Analytics takes a look at searches made.
For results, visit the Site Search area. You can see what terms are being searched for under Usage. It will also show whether they left, browsed more, or exited. This can help you understand if people are finding what they want. Seeing searches can also help you see what people want from your site so you can tune your content to be helpful for them.
Online Campaign Traffic
You can also check out how your marketing campaigns are doing and what is bringing the most traffic. You do this by going to Advanced Segments and building a new customer segment. You will fill in sites you have profiles on if you want to see how search directories are helping. Once you’ve added these, you can go back in later and see how traffic and conversion are working on each website so you can determine where to spend more time to enhance ROI.
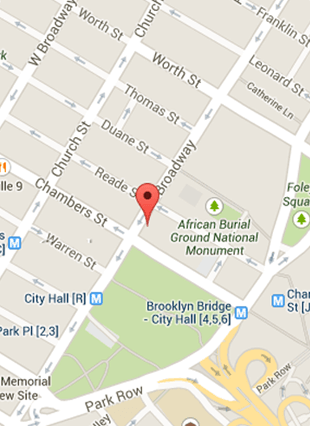
Determine Best Locations
If you aren’t sure who to target with ads, it can be a difficult decision to make. You may want to focus on certain countries or areas if those give better results, but first you have to know. Google Analytics makes that easy. Check out your Visitors menu to see Location data about your visitors. This gives information on average time on site, bounce rates, and more. You can also move into a country and see stats from certain regions. From there, you have a great list to target; who you know already are interested in your services.
Conclusion
If you are new to Google Analytics or want to delve into it more deeply, these suggestions will help you determine where to start or where to go from where you are. There are hundreds of other ways to utilize this tool, but doing even a few of the listed options here will help you find the people you want and turn that traffic into ROI and conversions to keep your business healthy.